
 Valerie Russell
6 min read
For Colleges: 3 New Plans Built Around Your Enrollment Goals
Every enrollment cycle brings a new set of priorities. Maybe this year it's yield. Maybe it's getting in front of junior-year students earlier, or...

Whether you love ‘em or hate ‘em, Scattergrams are popular among students, parents, and guardians.
Why?
Scattergrams provide valuable insights into the likelihood of acceptance at the colleges a student follows. At a glance, they show historical admission decisions using alumni students' GPAs, test scores, and other outcomes.
Informed by Scattergrams, students can be more purposeful in their list building, while proactively taking steps to ensure they’re in good standing, based on past performance.
Not all high schools take advantage of Scattergrams, especially in the wake of the test-optional movement. This has the potential to leave students, parents, and guardians in the dark.
Fortunately, it’s easy to populate Scattergrams in Scoir for students and their supporters who are using (or want to use) this tool.
Here's what we cover in this article. Feel free to jump to the section that's most relevant to you!
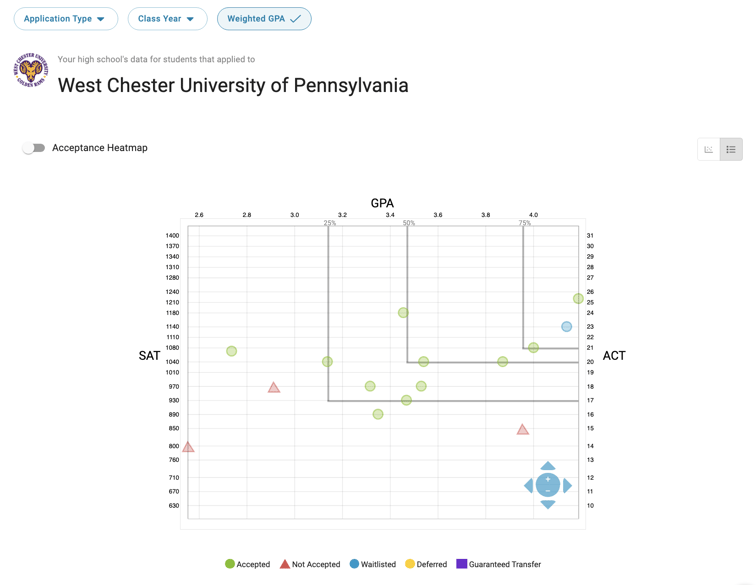
College Scattergrams are different for every school because they’re based on your students' unique test scores and outcomes. On the graph, you’ll see SAT scores on the left vertical axis and ACTs on the right. GPAs are across the top axis.
Students and supporters can view the plotted outcomes of prior students based on the uploaded test scores and GPAs. The star shows where the student viewing the Scattergram currently stands.
Customizing the view is easy so students can see plotted results based on class year, weighted and unweighted GPA, and more. They can also switch to a table view and see additional information such as Test Optional results and application outcomes.
Scattergrams are a great way for students, parents, and guardians to gauge their test scores and GPA performance. Counselors can also use college Scattergrams to evaluate student performance as a whole and gain insights on which areas to support certain students.
The more test score data you import, the more valuable Scattergrams will become.
Often, the obstacle students and their supporters encounter when viewing Scattergrams is a lack of data.
The #1 driver of that data is whether counselors upload ACT/SAT scores, GPAs, and college acceptance outcomes into Scoir. The good news is it's quick and easy. And, here are the upcoming ACT Release Dates and SAT Release Dates.
Counselors can bulk upload ACT/SAT scores and GPAs into Scoir, including test scores right from College Board. You can also permit students to self-report their own test scores and GPAs if you’d like.
You may be thinking, but wait—the buzzword right now is test optional.
We hear you!
While students can indicate in Scoir if they applied test optional, we still encourage you to add their test scores since most students continue to take these tests, even if they choose to apply test optional. The data is still relevant to Scattergrams.
Once you have all your test scores and GPAs imported, your next step is to ensure the application outcomes are added. These fall into the categories of Accepted, Not Accepted, Waitlisted, or Deferred on the Scattergram (here's how to add college application outcomes).
Every year as students go through application season, you’ll want to get in a rhythm of adding test scores, GPAs, and outcomes to ensure Scattergrams stay relevant.
We’ve created a helpful checklist you can use each year as a friendly reminder!
At the end of the day, Scattergrams are intended to help students gauge the likelihood of acceptance and are not intended to be a definitive predictor of admission. After all, there are other factors at play, like extracurricular activities, essays, and overall academic performance.
While everyone has their own opinion about Scattergrams and whether they find value in them, our hope is that students and supporters who do find them helpful have access to useful Scattergrams full of data!
Don’t forget to grab your free Scattergram Checklist before you go!
While Scattergrams provide valuable insights, they're limited to your high school's data. And, not all schools have a large pool of information to pull from.
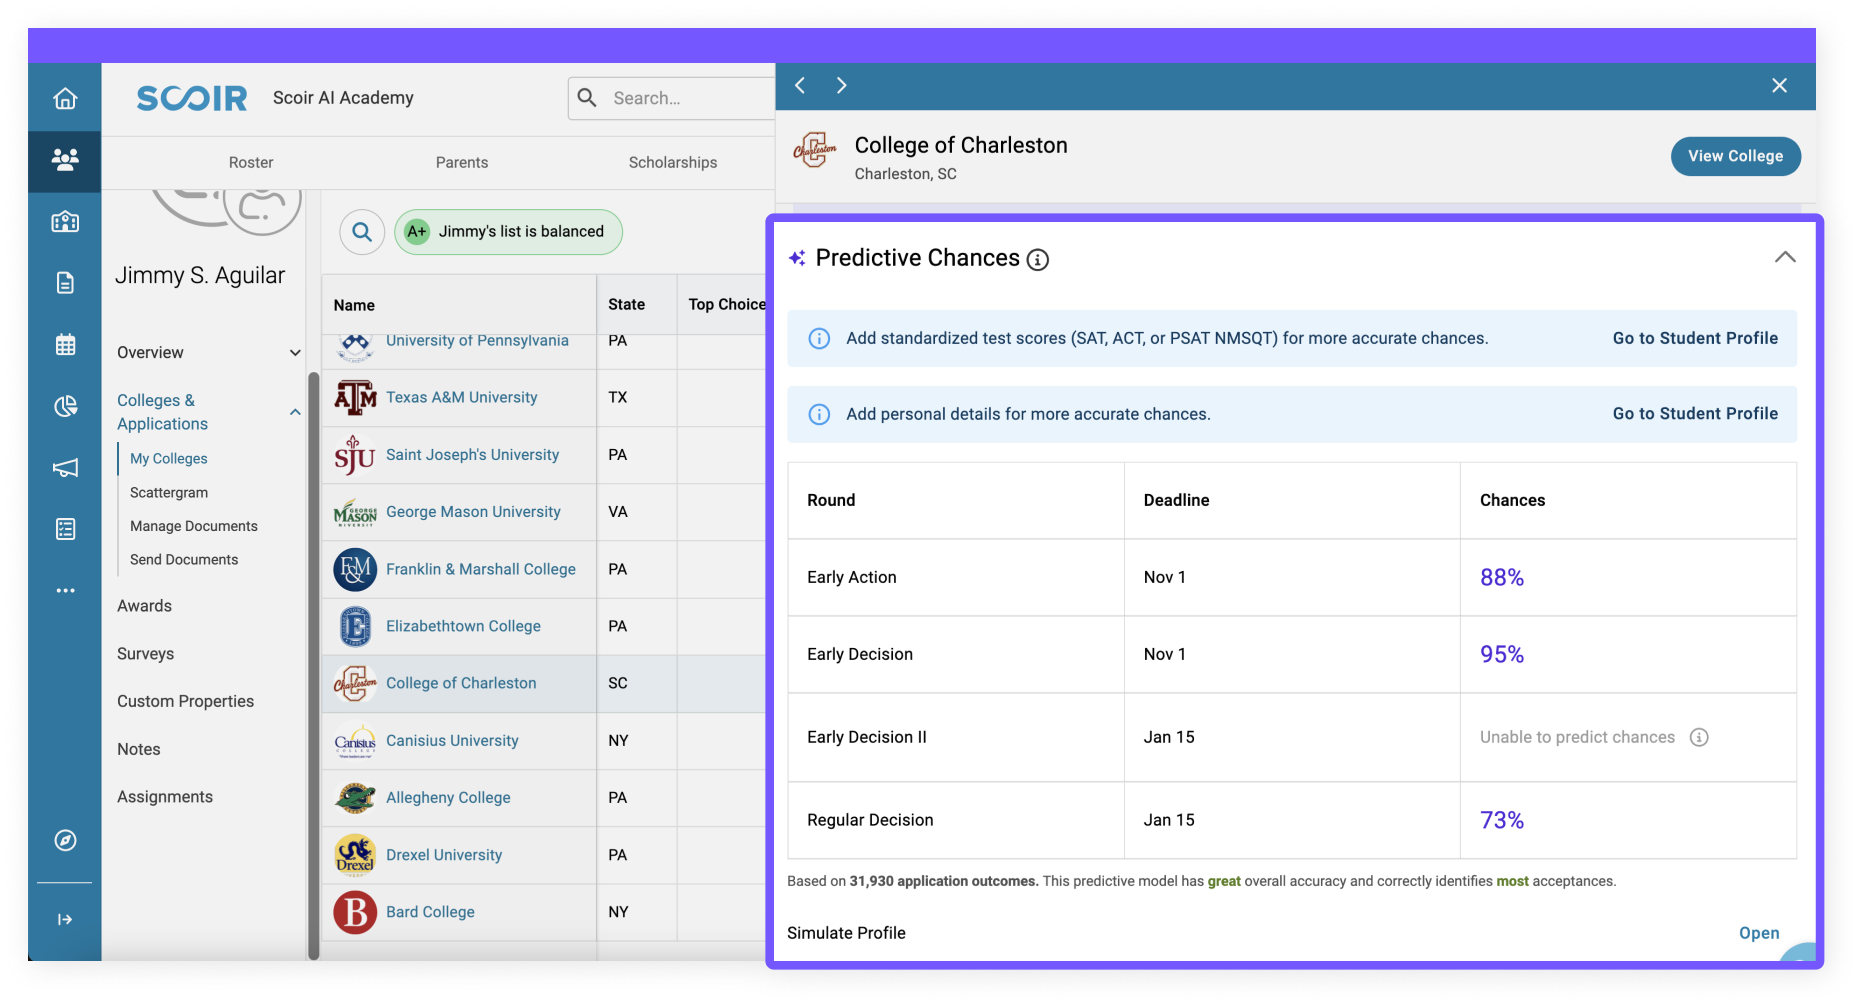
Now, counselors have access to Admission Intelligence—or as we like to call it, Scoir AI—a series of tools to help balance college lists and demystify acceptance chances, powered by tens of millions of de-identified outcome records.
Go beyond traditional metrics like GPA and test scores with Predictive Chances, a tool that is part of the Admission Intelligence suite! Using outcomes from thousands of individuals with similar profiles, see round-level and individual predictions for each college and help students make informed decisions about where to apply and when.
Like Scattergrams, Scoir AI factors in GPA and test scores, but it also pulls in information such as high school characteristics like 1st Gen and geographic location. It also considers whether the college is in-state or out-of-state.
Outcomes of the student’s school, as well as the outcomes of thousands of similar students and high schools across the network, are considered so you have more data to validate your findings.
Looking for quick answers to the most common questions about Scattergrams? You're in the right place!
Scattergrams are visual representations of historical admission decisions at colleges based on alumni students' GPAs, test scores, and other outcomes. They consist of a graph where SAT scores are on the left vertical axis, ACT scores on the right, and GPAs on the top axis.
Students and supporters can view plotted outcomes of prior students based on uploaded test scores and GPAs, with the star indicating the current student's position. Customization options allow viewing based on class year, weighted and unweighted GPA, and switching to a table view for additional information.
Scattergrams are valuable for students, parents, guardians, and counselors to gauge test scores and GPA performance. Counselors can use Scattergrams to evaluate student performance as a whole and identify areas to support certain students.
The import of more test score data enhances the value of Scattergrams. Counselors can bulk upload ACT/SAT scores and GPAs into Scoir, including scores from College Board. Students can also self-report their scores if permitted.
Counselors should establish a routine of adding test scores, GPAs, and outcomes annually to keep Scattergrams relevant. This Scattergram Checklist can help!
While Scattergrams provide historical data and helpful context, they should be used as one of several tools to understand admissions trends rather than as a definitive predictor of future outcomes.
This article was originally published on November 29, 2022. It was updated on October 9, 2024 for accuracy and comprehensiveness.

Val Russell is a Senior Manager of Product Marketing at Scoir. She's spent 12+ years helping products find their voice. She has a knack for translating the complex into the compelling, and has had a hand in more launches than she can count. From shaping messaging frameworks to running campaigns that actually move the needle, she's most at home where strategy meets storytelling.


6 min read
Every enrollment cycle brings a new set of priorities. Maybe this year it's yield. Maybe it's getting in front of junior-year students earlier, or...

5 min read
Top tips for admitted yield strategies: Keep admitted students engaged all summer with timely, multi-channel communication Push FAFSA completion...

3 min read
We’ve rounded up helpful resources, tips, and advice for students to help guide you during this pivotal time. Whether you’ve been put on a waitlist,...